2.) Aluminum screen (can be purchased at home supply store such as Home Depot)
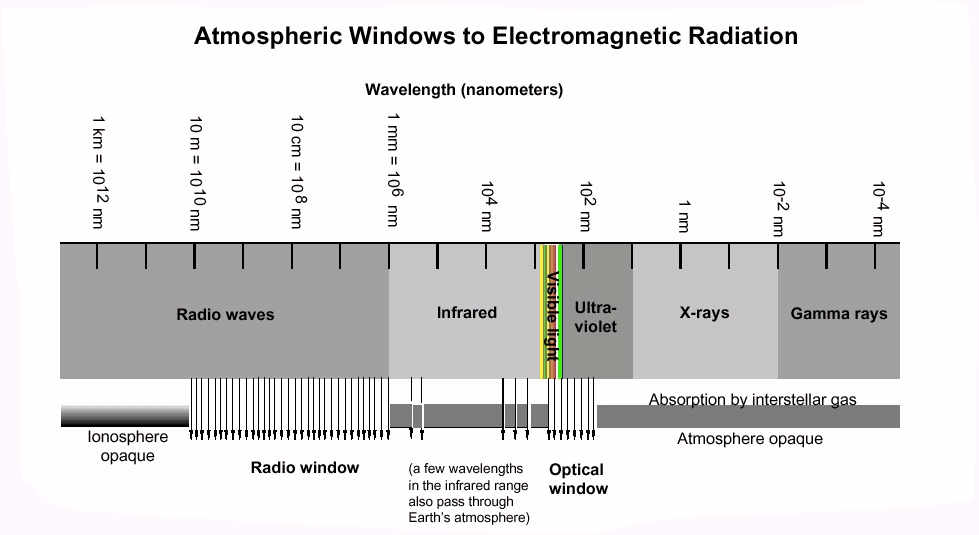
The electromagnetic spectrum consists of waves of many wavelengths ranging from very long wavelength radio waves to very short wavelength gamma rays. Visible light, consisting of short wavelength waves, is placed near the middle of this spectrum.
Visible light can pass through window glass, but a solid wall will absorb a portion of the light and reflect the remaining portions. Scientists would say that glass is transparent to visible light, but a wall is opaque.
Since the atmosphere is transparent to visible light (while absorbing some of the light), astronomers who use telescopes can see things from far away using visible light to form images.
Earth's atmosphere, however, acts an opaque barrier to much of the electromagnetic spectrum. The atmosphere absorbs most of the wavelengths shorter than ultraviolet, most of the wavelengths between infrared and microwaves, and most of the longest radio waves. For radio astronomers this leaves only short wave radio to penetrate the atmosphere and bring information about the universe to our Earth-bound instruments. The main frequency ranges allowed to pass through the atmosphere are referred to as the radio window. The radio window consists of frequencies which range from about 5 MHz (5 million hertz) to 30 GHz (30 billion hertz). The low-frequency end of the window is limited by signals being reflected by the ionosphere back into space, while the upper limit is caused by absorption of the radio waves by water vapor and carbon dioxide in the atmosphere. As atmospheric conditons change the radio window can expand or shrink. On clear days with perfect conditions signals as high as 300GHz have been detected.
It is the effects of the ionosphere on the lower end of the radio spectrum that we will investigate in this exercise.
The ionized part of the Earth's atmosphere is known as the ionosphere. Ultraviolet light from the sun collides with atoms in this region knocking electrons loose. This creates ions, or atoms with missing electrons. This is what gives the Ionosphere its name and it is the free electrons that cause the reflection and absorption of radio waves.
How does this affect our observations of Jupiter?
When the sun is overhead during the day, most of the ionosphere is ionized due to the large amount of ultraviolet light coming from the sun. As radio waves enter Earth's atmosphere from space some of the waves are absorbed by the electrons in the ionosphere while others pass through and are detectable to ground based observers. The frequency of each of these waves is what determines whether or not it is absorbed or able to pass through the atmosphere. Low frequency radio waves do not travel very far through the atmosphere and are absorbed rather quickly. Higher frequency waves are able to pass through the atmosphere entirely and reach the ground.
This process also works in reverse for radio waves produced on the earth. The high frequency waves pass through the ionosphere and escape into space while the low frequency waves reflect off the ionosphere and essentially "skip" around the earth.
The diagram below will help illustrate this:
What's all this talk about high frequency and low frequency radio waves? What types of things fall in each range?
Astronomical radio sources emit over a wide range of frequencies. Their emission can be measured ranging from low frequencies to high frequencies. Jupiter for example emits radio waves from about 10 kHz up to about 300 GHz. This emission is broken into several groupings. The lowest being the kilometric emission which ranges from 10kHz up to 1000kHz. Other frequency groups include hectometric (1000KHz to 3MHz), decametric (3MHz to 40MHz), and decimetric (100MHz to 300GHz). It is the decametric emissions that we are concerned about with Radio Jove. The Radio Jove receiver is tuned to a frequency of 20.1MHz.
Radio waves produced on Earth are mostly manmade and are often at one specific frequency. In fact, this is one way astronomers can tell a signal created on Earth apart from an astronomical signal. If they are able to tune their receivers to a slightly higher or lower frequency and the signal disappears it is most likely an Earth based signal. Radio waves fall into three main categories with a variety of uses:
 H.F. (High Frequency 3 to 30MHz)
Long Range communications. Shipping, Aircraft, World Broadcast Communications, Radio Amateurs.
Use involves reflecting the signal off the ionosphere back down to waiting recieving stations. Prone to atmospheric changes causing fading and noise.
Range from 500 to thousands of Kilometres.
V.H.F. (Very High Frequency 30 - 300 MHz)
Medium range communications. Fleet vehicles, mobile, coastal shipping and air to tower communications.
Range 70-100km (aircraft several hundred km).
U.H.F (Ultra High Frequency 300-3000 MHz)
This is the domain of such things as Police handheld radios, cell-phones, T.V., and spacecraft to ground communications. In the high U.H.F. range the signal can "bounce" off buildings and reflect until it is detected by a receiver.
Activities
We can use the aluminum screens to mimic the effects of the ionosphere. To do this follow the following steps:
1.) Take the AM radio outside and tune in an AM station.
2.) Using the aluminum screen construct a small cage which you can place over the AM receiver. After placing the cage over the receiver observe how the station is weaker or disappears.
3.) Remove the cage and the station returns.
The screen acts as a solid object to the incoming radio waves. We can imagine the radio as an Earth based receiving station. The screen, like the ionosphere, reflects the low energy AM radio waves and they are not detectable.
Below is an animation comparing the ionospheric conditions during a typical day with that of a day containing an ionospheric storm. An ionospheric storm is caused by a coronal mass ejection from the sun that strikes the Earth's atmosphere. These mass ejections contain large amounts of particles that smash into the ionosphere and knock electrons loose from atoms. As discussed above the loose electrons reflect radio waves from astronomical sources back into space. The addition of loose electrons as a result of a mass ejection makes observations and communications difficult. The dark blue and purple areas are the areas where the number of loose electrons is low. In these areas there are few electrons to reflect radio waves and thus lower frequency waves are able to reach the ground. As can be seen from the animations the night time and early morning hours are best for observations due to the fact that the sun is not in the sky and its ultraviolet light is not reaching the atmosphere at this time.
The density of electrons (how many electrons there are per every cubic centimeter) is represented by the varying colors. Bands of high density that appear at high latitudes during the storm but disappear rapidly as it subsides are due to the high velocity particles smashing into the atoms in the atmosphere and knocking electrons free. These same high velocity particles produce the auroral lights. We can use these maps and the varying colors to find the lowest frequency that is detectable from the ground. The lowest frequency detectable, known as the critical frequency, is related to the density of electrons by the equation: f = 9x10^-3 x sqrt(N) MHz. In this equation f is the critical frequency and N is the electron density, sqrt means to take the square root of the electron density. In the maps above the electron density ranges from 33300 electrons/cm^3 (dark blue) to 249750 electrons/cm^3 (green) to 552780 electrons/cm^3 (red).
Exercise
Use these values to calculate the critical frequency for the dark blue, green and red areas on the maps.
dark blue = 1.8 MHz, green = 5 MHz and red = 7.2 MHz
Questions and Problems
The speed of all electromagnetic waves (the speed of light, or c) is 300,000,000 meters per second (3 x 10^8 m/s). The distance traveled (d) by an electromagnetic wave in time (t) is given by the equation: d = c x t.
The frequency and wavelength of an electromagnetic wave are related by the equation: c =
where f is the frequency of the wave, c is the speed of light, and
Example 1.) How long would it take a radio wave to travel to Earth from the moon? The moon is 400,000 kilometers from Earth. (Note: 400,000 kilometers = 4x10^8 meters.)
4x10^8 = 3x10^8 t
t = 1.33 seconds
Example 2.) What is the wavelength of a radio wave with a frequency of 500kHz?
3x10^8 =
1.) If radio astronomers are studying 20MHz radio signals from the sun which is 1.5x10^11 meters away from the Earth, how long did take for the radio signals to reach Earth?
t = 500 seconds
2.) 3MHz is the lowest frequency which will pass through the ionosphere. Calculate the wavelength of these waves.
![]() = 100 meters
= 100 meters
3.) A general rule is that a spacing on the order of 1/10 of a wavelength will seem solid to a radio wave. What size would the spacings in our mesh screen have to be in order to block the 20MHz solar radio waves discussed in problem 1?
![]() = 15 meters, spacing = 1.5 meters
= 15 meters, spacing = 1.5 meters
4.) As shown above, the ionosphere can act as a solid object to radio waves. Using this idea do you think it is possible to build a radio dish that is not solid? If so, what are the benefits and advantages of a mesh dish?
lightweight, saves building costs,
not much gathers inside (rain, snow, leaves, etc.),
in cases of
large antennas a mesh can allow sunlight to
reach the ground below
and help prevent erosion
of soil by allowing growth
of grass and
plant life.
5.) If spacings of 1/10 of a wavelength seem solid to electromagnetic waves would imperfections in a solid radio dish (holes or knicks) of this size matter? Radio studies deal with waves ranging from about 100m to 1mm. If we built a solid dish for each of these extremes (100m and 1mm) how small could the imperfections in our antenna be?
10 meters and .1mm (or .0001m)
Credits
The H.F/V.H.F./U.H.F. image located in the section describing high and low frequency radio waves as well as the Earth image under the ionosphere section are courtesy of Elbate Engineering LTD.
http://www.voyager.co.nz/~elbate/propo.htm
http://www.voyager.co.nz/~elbate/propo2.htm